Since the second installment (10 Jan 2024), Mr. Ramaswamy has left the Republican presidential campaign following the caucus in Iowa. Mr. Trump won that election decisively: trump at 51%; DeSantis at21%; Haley at 19%, Ramaswamy at 8% and Hutchinson at 1%. Mr. Ramaswamy’s exit leaves Governor Nikki Haley and Governor Ron DeSantis as the main rivals to Mr. Trump, followed by Governor Asa Hutchinson.
This third installment discusses the Democratic Party’s approach to the economy during the campaign.
Congress gave the Federal Reserve (the U. S. central bank) three objectives when setting monetary policy: a) low inflation; b) low unemployment; and c) high economic growth. Every rational economist knows that any two of these (if the Federal Reserve is both honest and lucky) can be achieved only by sacrificing the other one, as detailed elsewhere [1]. In practice, the Federal Reserve is doing well if it accomplishes one objective and part of a second. These are the three common metrics by which the economy is characterized, and are therefore the three main economic political talking points.
3.1 Inflation
The spending polices and high deficits since 2021 have led to a large increase in monetary inflation, as reflected in the Consumer Price Index (CPI). Figure 3.1-1 shows the official statistics:
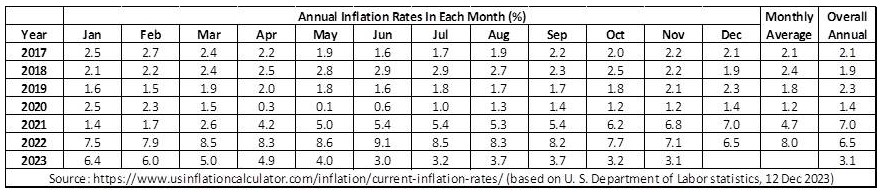
Figure 3.1-1: Inflation Data per CPI, 2017-2023
The annual inflation rate (last column) averaged about 2% during Mr. Trump’s term, but the spending under Mr. Biden caused it to increase to 7% in 2021. The highest monthly rate during Mr. Trump’s term was 2.9% in the summer of 2018; it increased to 9.1% under Mr. Biden in Jun 2022. This doesn’t look good, but Democrats will adopt the tactic of confusing the public by making inflation appear beneficial. It is likely that the inflation created by the Biden administration (and Congress) will have been suppressed by the Federal Reserve down to about 3% annual by the Nov 2024 election. (It was accomplished by increasing interest rates, which flowed down to increasing mortgage rates.) The Democrats will claim that Biden “tamed inflation”, thus falsely implying that inflation was high under Trump. The Democrats will also point to the stock market averages. The Dow Jones Industrials closed at 30,306 on 31 Dec 2020; it closed at 37,689 on 29 Dec 2023; an increase of 24.4% relative to 2020. The S&P 500 closed at 3,756 on 31 Dec 2020 and at 4,769 on 29 Dec 2023, an increase of 27% relative to 2020. What the Democrats won’t say is that stock prices follow a similar trend to other prices: they sometimes increase during an inflationary period, as is the case here. They won’t mention that both indices fell dramatically in 2022. Mr. Biden will have no difficulty ordering the Bureau of Labor Statistics to modify the composition of the Consumer Price Index to make it look like the overall cost of living is falling. The Democrats will point to increasing family income, conveniently ignoring the fact that wages generally increase during an inflationary period, and that many people have had to take second jobs to make ends meet.
3.2 Unemployment
Figure 3.2-1 shows the national unemployment rate (%) for the Trump and Biden periods. Notice that the unemployment rate was about 5.1% at the beginning of Trump’s term, and had declined to about 3.4% in Dec 2019, just prior to the onset of China’s gift to the world, the Wuhan virus.
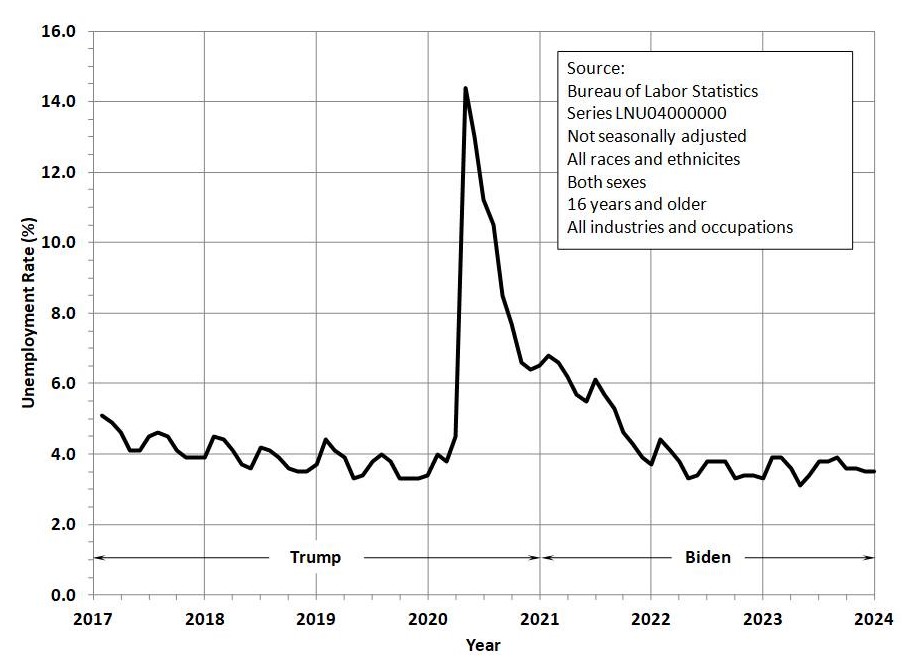
Figure 3.2-1: Unemployment Rate, 2017-2023
Notice also the large spike in the unemployment rate in the summer of 2020, when the Governors of many States (especially in Democratic ones) imposed lockdowns on their respective populations. As the Wuhan virus faded and the Democrats were forced to give up their arbitrary powers, many of those who became unemployed in 2020 have now found other jobs. The Democrats will claim that the Biden administration’s policies have “brought America back from the Trump-induced economic depression” conveniently ignoring that it was done mostly by Democrat Governors. The Democrats will cite the continuously lowering unemployment rate between 2021 and 2024, conveniently ignoring: a) most of the jobs that were created during the Biden administration simply replaced those lost during the Wuhan pandemic; b) many people have to work two jobs to get by due to the monetary inflation caused by the increased spending by Congress as promoted by Mr. Biden; and c) many of the new jobs are low-wage part-time work. No one in the mainstream media will take the time to analyze the data to inform their viewers of the actual state of unemployment (i.e., what kind of jobs, seasonal or not, part-time or not, government or private sector, etc.). It is highly likely that the fastest growing employment segment during the Biden administration is in government jobs.
3.3 Growth
Growth is measured by the U. S. Bureau of Economic Statistics as the Gross Domestic Product (GDP). Figure 3.3-1 shows the GDP, along with the M2 money supply and the velocity of money [2]. The GDP values are not the GDP for each quarter; they are estimates of the annual GDP issued each quarter. For example, the total GDP was $25,462.7 B for the entire year 2022; the chart shows just under $25,000 in the first quarter of 2022 (i.e., the estimated annual value based on data in the first quarter of 2022). The M2 money supply is a metric issued by the Federal Reserve; it is approximately the total supply of money exclusive of large time deposits [3]. The velocity of money is defined as the nominal GDP divided by the M2 money stock. It has for the past two decades declined from about 2 to about 1.5. A rapid decline in the money velocity indicates a rapid increase in the money supply; and values less than about 1.4 indicate that money supply is growing at rates in excess of historical norms.
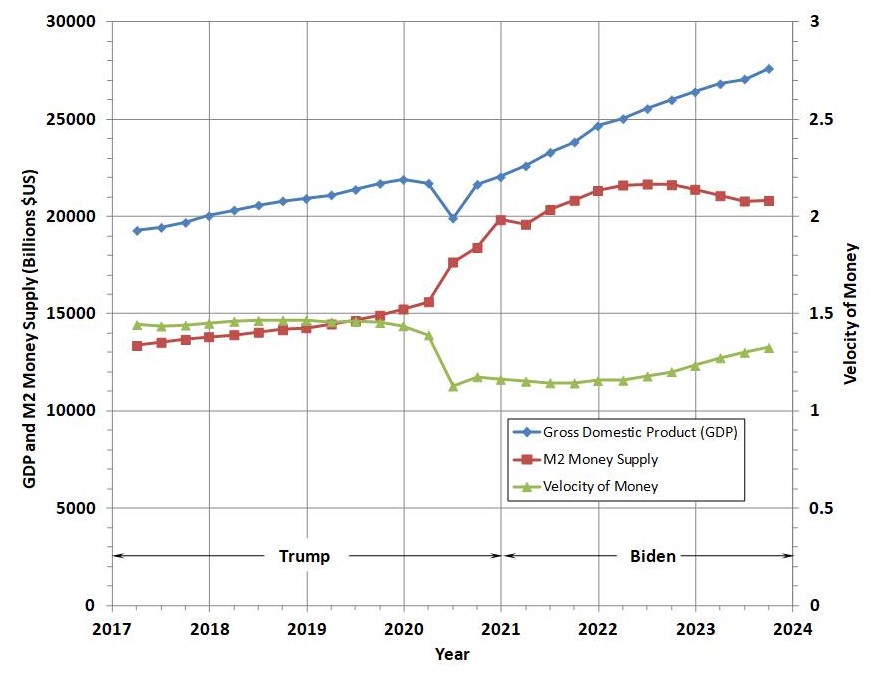
Figure 3.3-1: GDP, Money Supply, and Velocity of Money, 2017-2023
It is obvious from Figure 3.3-1 that economic growth was stable between 2017 and 2019: the velocity of money was within historical norms at 1.45 or so; and the rate of GDP was increasing slightly faster than the rate of M2 money supply. Then in 2020, the Wuhan virus led Congress and the Trump administration to inject a large amount of new money into the system (via the CARES Act), corresponding to a rapid decline in the velocity of money. By the beginning of 2021, the GDP was back where it was at the beginning of 2020 after suffering a large decline in the summer of 2020 due to the economic lockdowns imposed in many places. Congress and the Biden administration continued to increase the money supply until mid-2022, when it began to decline. Meanwhile the velocity of money remained below normal and the GDP increased steadily between 2021 and 2023. The increase in the GDP is a symptom of monetary inflation, due primarily to the increase in the money supply (recall that V = GDP/M2). The Democrats will use this data to make two false claims. First, that GDP was stagnant during the last year of the Trump administration because of his favor-the-rich policies, ignoring the fact that it was due to an incorrect lockdown response to the Wuhan virus. Second, they will claim that GDP increased only 14.2% during Trump’s four years (i.e., from $19.2 T to $22.0 T) due to his faulty economic policy; but increased by 25.3% (i.e., from $22.0 T to $27.6 T) in only three years under Biden due to his great policies. The numbers are correct; the falsehood lies in the fact the growth in GDP under Biden is due to the increase of the money supply that led to inflation, which led to higher prices, and the resulting increase in the cost of living (cf. CPI per Figure 3.1-1).
Figure 3.3-1 shows one other thing of importance; namely the decline in the money supply after mid-2022. This may indicate a deflationary trend, which was one of the reasons the recession of 1929 became the Great Depression of the 1930’s [4]. It is well known that prices tend to lead wages; in other words, price effects are felt before wage adjustments occur. In an inflationary trend (where the money supply is increasing), prices go up faster than wages. That is bad for wage-earners because their current wages do not buy as much until they get a raise later. The situation is similar for a deflationary trend (when the money supply is decreasing). Prices lead wages; thus prices will fall faster while wages remain stable. That seems to be a good trend, but it can operate only temporarily. The reason is: as prices fall and wages remain stable, businesses that are labor-intensive will see a decline in profits, which will force them to lay off workers. Thus a deflationary cycle will generally lead to higher unemployment (the central problem of the 1930’s).
3.4 Summary
As you can see, the Democrats have plenty of false notions of economics but plenty of statistics to make their policy appear beneficial. The Democrats will say it; the mainstream media, academia, Hollywood, and the social media empires will continuously chant it, and the federal bureaucracy (including the Federal Reserve) will confirm it. The people will believe it and vote accordingly … unless the Republicans find a backbone and figure out how to counter this Marxist propaganda.
References
1. Edward D. Duvall, The Control and Manipulation of Money, Queen Creek, AZ: Fremont Valley Books, 2023, pp. 80, 81, 162-168, 395-414. It is available as a free pdf at:
It is available in print at:
https://www.barnesandnoble.com/w/the-control-and-manipulation-of-money-edward-d-duvall/1143739227
2. The source data for Figure 3.3-1 is as follows:
a. GDP: Vintage History of Quarterly Gross Domestic Product (GDP) and Gross Domestic Income (GDI) Estimates; Bureau of Economic Analysis, https://www.bea.gov/data/gdp/gross-domestic-product; then select “Previously Published Estimates”, this provides file gdp-gdi-vintage-history.xlsx; I have used the 28 Dec 2023 revised estimates.
b. Velocity of Money: Federal Reserve at https://fred.stlouisfed.org, Velocity of M2 Money Stock, series M2V, file = M2V.xls
c. M2 Money Stock: Federal Reserve at https://fred.stlouisfed.org/series/M2SL
3. op. cit., Duvall, p. 601
4. op. cit., Duvall, pp. 439-441


