Archive for the ‘federal budget’ Category

Real World Graduation: Question 26

RealWorldGraduation_Question_26  <– PDF

Some political operatives stated during 2008 that there was a $5 trillion surplus at the end of the Clinton administration (20 Jan 2001).  The total national debt as of 30 Sep 2008 is $10.024 trillion, per the official U. S. treasury records [1].  The table below shows the budget deficits for each year of the G. W. Bush administration.  Keep in mind that a trillion is 1000 billion.  The total of all the deficits during the G. W. Bush administration is 4.35 trillion as shown at the bottom of the table.  A surplus of $5 trillion when Bush came into office, and a total debt of $ 10.024 as of 30 Sep 08 represents an increase in the debt of 15.024 trillion.  Where did all the money go?

a) George W. Bush, Richard V. Cheney, and all their crooked friends on Wall Street stole it.

b) It was spent on the war in Iraq.

c) It was spent on the war in Afghanistan

d) The rich people got tax cuts

e) Some combination of b), c), and d); and the jury is out on the possibility of answer a).

Year Ending       Deficit ($ Trillion)

30 Sep 2001          0.133

30 Sep 2002         0.421

30 Sep 2003         0.555

30 Sep 2004         0.596

30 Sep 2005         0.553

30 Sep 2006         0.574

30 Sep 2007         0.501

30 Sep 2008        1.017

Total deficits during G. W. Bush’s time in office = $4.45 Trillion

[1]        www.treasurydirect.gov/NP/BPDlogin?application=np

(The answer is shown on p. 2 of the PDF.)

Tags: , ,
Posted in critical thinking, Economics, federal budget, national debt, Real World Graduation | No Comments »

Barack H. Obama’s Legacy, Part 5

ObamaLegacyPart5 <– PDF

In closing out Mr. Obama’s domestic agenda, we come to the state of the national debt. The national debt had been growing for many years, but it reached and surpassed a critical point during Mr. Obama’s tenure.  It is true that President’s are not directly responsible for the nation’s debt (because only Congress can authorize a budget), but Presidents can use their influence to restrain the worst instincts of Congress.  Mr. Obama did nothing but encourage Congress’ reckless spending.  Figure 1 shows the nation’s GDP, total national debt, and ratio of GDP to debt for the years 1929 to 2016 in current-year dollars.  The ratio of GDP to debt is an important indicator of the nation’s liabilities compared to its total economic activity; higher is better.  These figures are not exactly in alignment, since the debt figures are for fiscal years, and the GDP values are for calendar years.  The general trend is accurate.

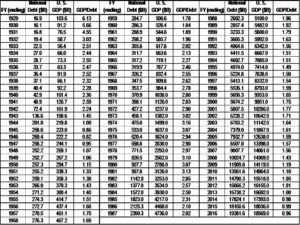
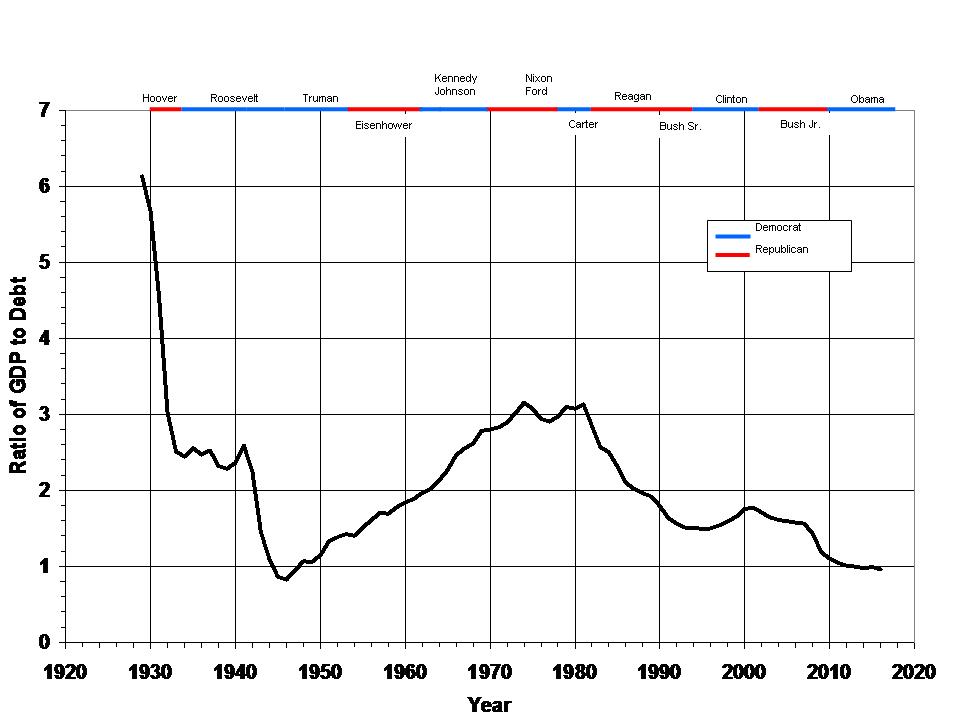
Figure 1: GDP, National Debt, and GDP-to-Debt Ratio, 1929 – 2016

Figure 2 shows the ratio of debt to GDP for the same interval. When Hoover entered office in 1929, the nation’s finances were in excellent shape, as the GDP-to-debt ratio was over six.  Then came the Great Depression, which nitwit Hoover made worse with his bad policies.  The GDP-to-debt declined drastically in the early 1930’s.  It was left to the even bigger nitwit Roosevelt to extend the depression to 1940 with his even worse policies, although the GDP-to-debt remained fairly static around 2.5 from 1934 to 1940.    It was not until Hitler rescued Roosevelt by starting World War II that the American economy came back to life.  The downside in financial terms is that the expansion of production was paid for by adding it onto the debt.. The GDP to debt ratio reached its all-time low in 1946 (0.82), just after the enormous debts accumulated during World War II.  From the Truman to Nixon administrations, the debt increased, but GDP increased faster, and the GDP to debt ratio steadily improved, reaching 3.16 in 1974.  It remained fairly steady until the halfway through Reagan’s first term; it then began a long slow protracted decline until halfway through the Clinton administration.  It improved a bit from there until about 2007, the second-last year of Bush Jr. administration, and then resumed its steady decline until sinking below 1.0 in 2014.  It is interesting to observe that one can draw a straight line from 1994 to 2011 and end up in the same place. It has continued a slight decline since 2014.

Many economists consider a GDP-to-debt ratio to be an accurate indicator of high risk. It is comparable to a household with debt equal to an entire year’s income.  In the long run, it is unsustainable.

So the U. S. financial condition is now about where it was in 1947.  But there is a big difference between the federal government obligations in 1947, wherein it began a long period of improvement, and now.  In 1947, there was no Medicare, no Medicaid, no Obamacare with its subsidies, no extensive social spending, no pervasive meddling bureaucracy to be paid, and Social Security was only a small item in the budget.  Mr. Obama was content to let the financial condition deteriorate without making some sort of attempt to get back on a sound financial footing.  We can only hope that Mr. Trump will not make the same mistake.

Figure 2: GDP-to-Debt Ratio, 1929-2016

Tags: , ,
Posted in Economics, federal budget, national debt, Uncategorized | No Comments »

The Financial Status of Social Security, part 4

FinancialStatusOfSocialSecurity_Part4   <– PDF version

Dear readers:

This post, the fourth in a  series on Social Security, is available only in PDF form owing to the graphics.

Thanks for reading,

EDD

Tags:
Posted in Congress, federal budget | No Comments »

FinancialStatusOfSocialSecurity_Part2   <– PDF version

Some analysts and economists have claimed that the Social Security system is nothing more than a Ponzi scheme.  I believe I can show that there are enough differences between the two to demonstrate that this claim is incorrect.

Let’s begin by reviewing what Ponzi scheme is.  It was named for Carlo Ponzi, a Boston businessman who talked people into investing in a plan to earn a profit through arbitrage of international reply coupons (IRC).  An IRC is an international agreement by which nations agree to deliver mail from other nations within their postal system.  Ponzi’s plan was to take advantage of the difference in postal rates among the various nations participating in the IRC treaty.  His plan fell through with great losses because the overhead on each transaction was too high.  Ponzi’s plan started as a legitimate enterprise, but he turned it into a fraud when he started realizing losses.  He then diverted money provided by new investors by using it to pay off the original investors, while also taking a cut for himself.  In honor of Mr. Ponzi, any investment plan in which early investors are paid off with funds provided by new investors instead of profits is now called a Ponzi scheme.  Instead of earning money by wise investing, the fund managers camouflage their losses by sending out false financial statements.  When necessary, they make payments to the original investors by robbing the newer investors.  This continues until the management runs out of new investors, or the operators steal everything they can.  Normally, Ponzi schemes attract investors by claiming to have invented some secret stock market advantage, or by claiming to have discovered some hidden trading tactic that is always profitable. With that background in mind, here are five reasons why Social Security is not a Ponzi scheme.

1.  “Investing” in a Ponzi scheme is voluntary, “investing” in Social Security is not.  If you are working, whether for wages or in business for yourself, you are inducted into the system except for some very narrow exceptions (usually involving employment by a religious institution).

2.  A Ponzi scheme, although fraudulent, is ultimately subject to Securities regulation, thus incurring a legal obligation to conduct the business honestly (although they have no intention of doing so). Social Security is not subject to any regulation; the Social Security Administration is under no legal obligation to pay benefits: it operates solely on the whim of Congress.

3.  Because a Ponzi scheme is set up to be nominally subject to regulation, an investor can demand to get his money back at any time.  However, no one can get their Social Security “investment” back until they meet age or disability requirements set by Congress.

4.  A Ponzi scheme is based on attracting a small number of wealthy people to invest in it; thus it robs the rich when it fails.  Social Security is based on forcing a large number of poor and middle class people to participate; thus it will rob the poor and middle class when it fails.

5.  Ponzi scheme managers send out false financial statements to give the illusion that it is solvent in the short run.  The Social Security Administration publishes honest financial statements that prove that it is insolvent in the long run.


Tags: ,
Posted in Congress, Economics, federal budget, government powers, off-budget spending | No Comments »